This is an analysis of how party support correlates across the regional list ballot in the 2026 Scottish Parliament election, computed from per-constituency results in all eight regional list contests. The intention was to find out whether or not the Independent Green Voice (IGV) vote was just "stolen" from Scottish Greens.
Note that this is looking at correlations and data scatter, and correlation does not imply causation. Even if the data showed that IGV got exactly 10% of the Scottish Greens (SGP) vote everywhere (which it does not), then it does not prove that IGV got their votes from SGP mistaken votes. Also, while we know that some voters definitely did vote IGV by mistake, I don't have any numbers for how many (and I doubt we could ever find out directly).
I'm not a data scientist or a statistician, so there may be mistakes, but none of this is very complex, so you would hope not!
For each of the 73 constituencies that contribute to a regional list, the votes cast for every party on the regional list were combined into a constituency × party matrix. Pearson correlations were then computed across constituencies — one correlation value for each pair of parties — both on the raw vote counts and on each constituency's vote shares (each constituency normalised to fractions of valid ballots cast). The share-based correlations remove the effect of differing constituency size and turnout (or we would find spurious correlations because parties get more votes in constituencies with more voters).
From that, the following are calculated.
Pearson correlation coefficients of the vote share for the parties.
Scatter plots of the party vote shares.
Raw data is linked to from the bottom of this page.
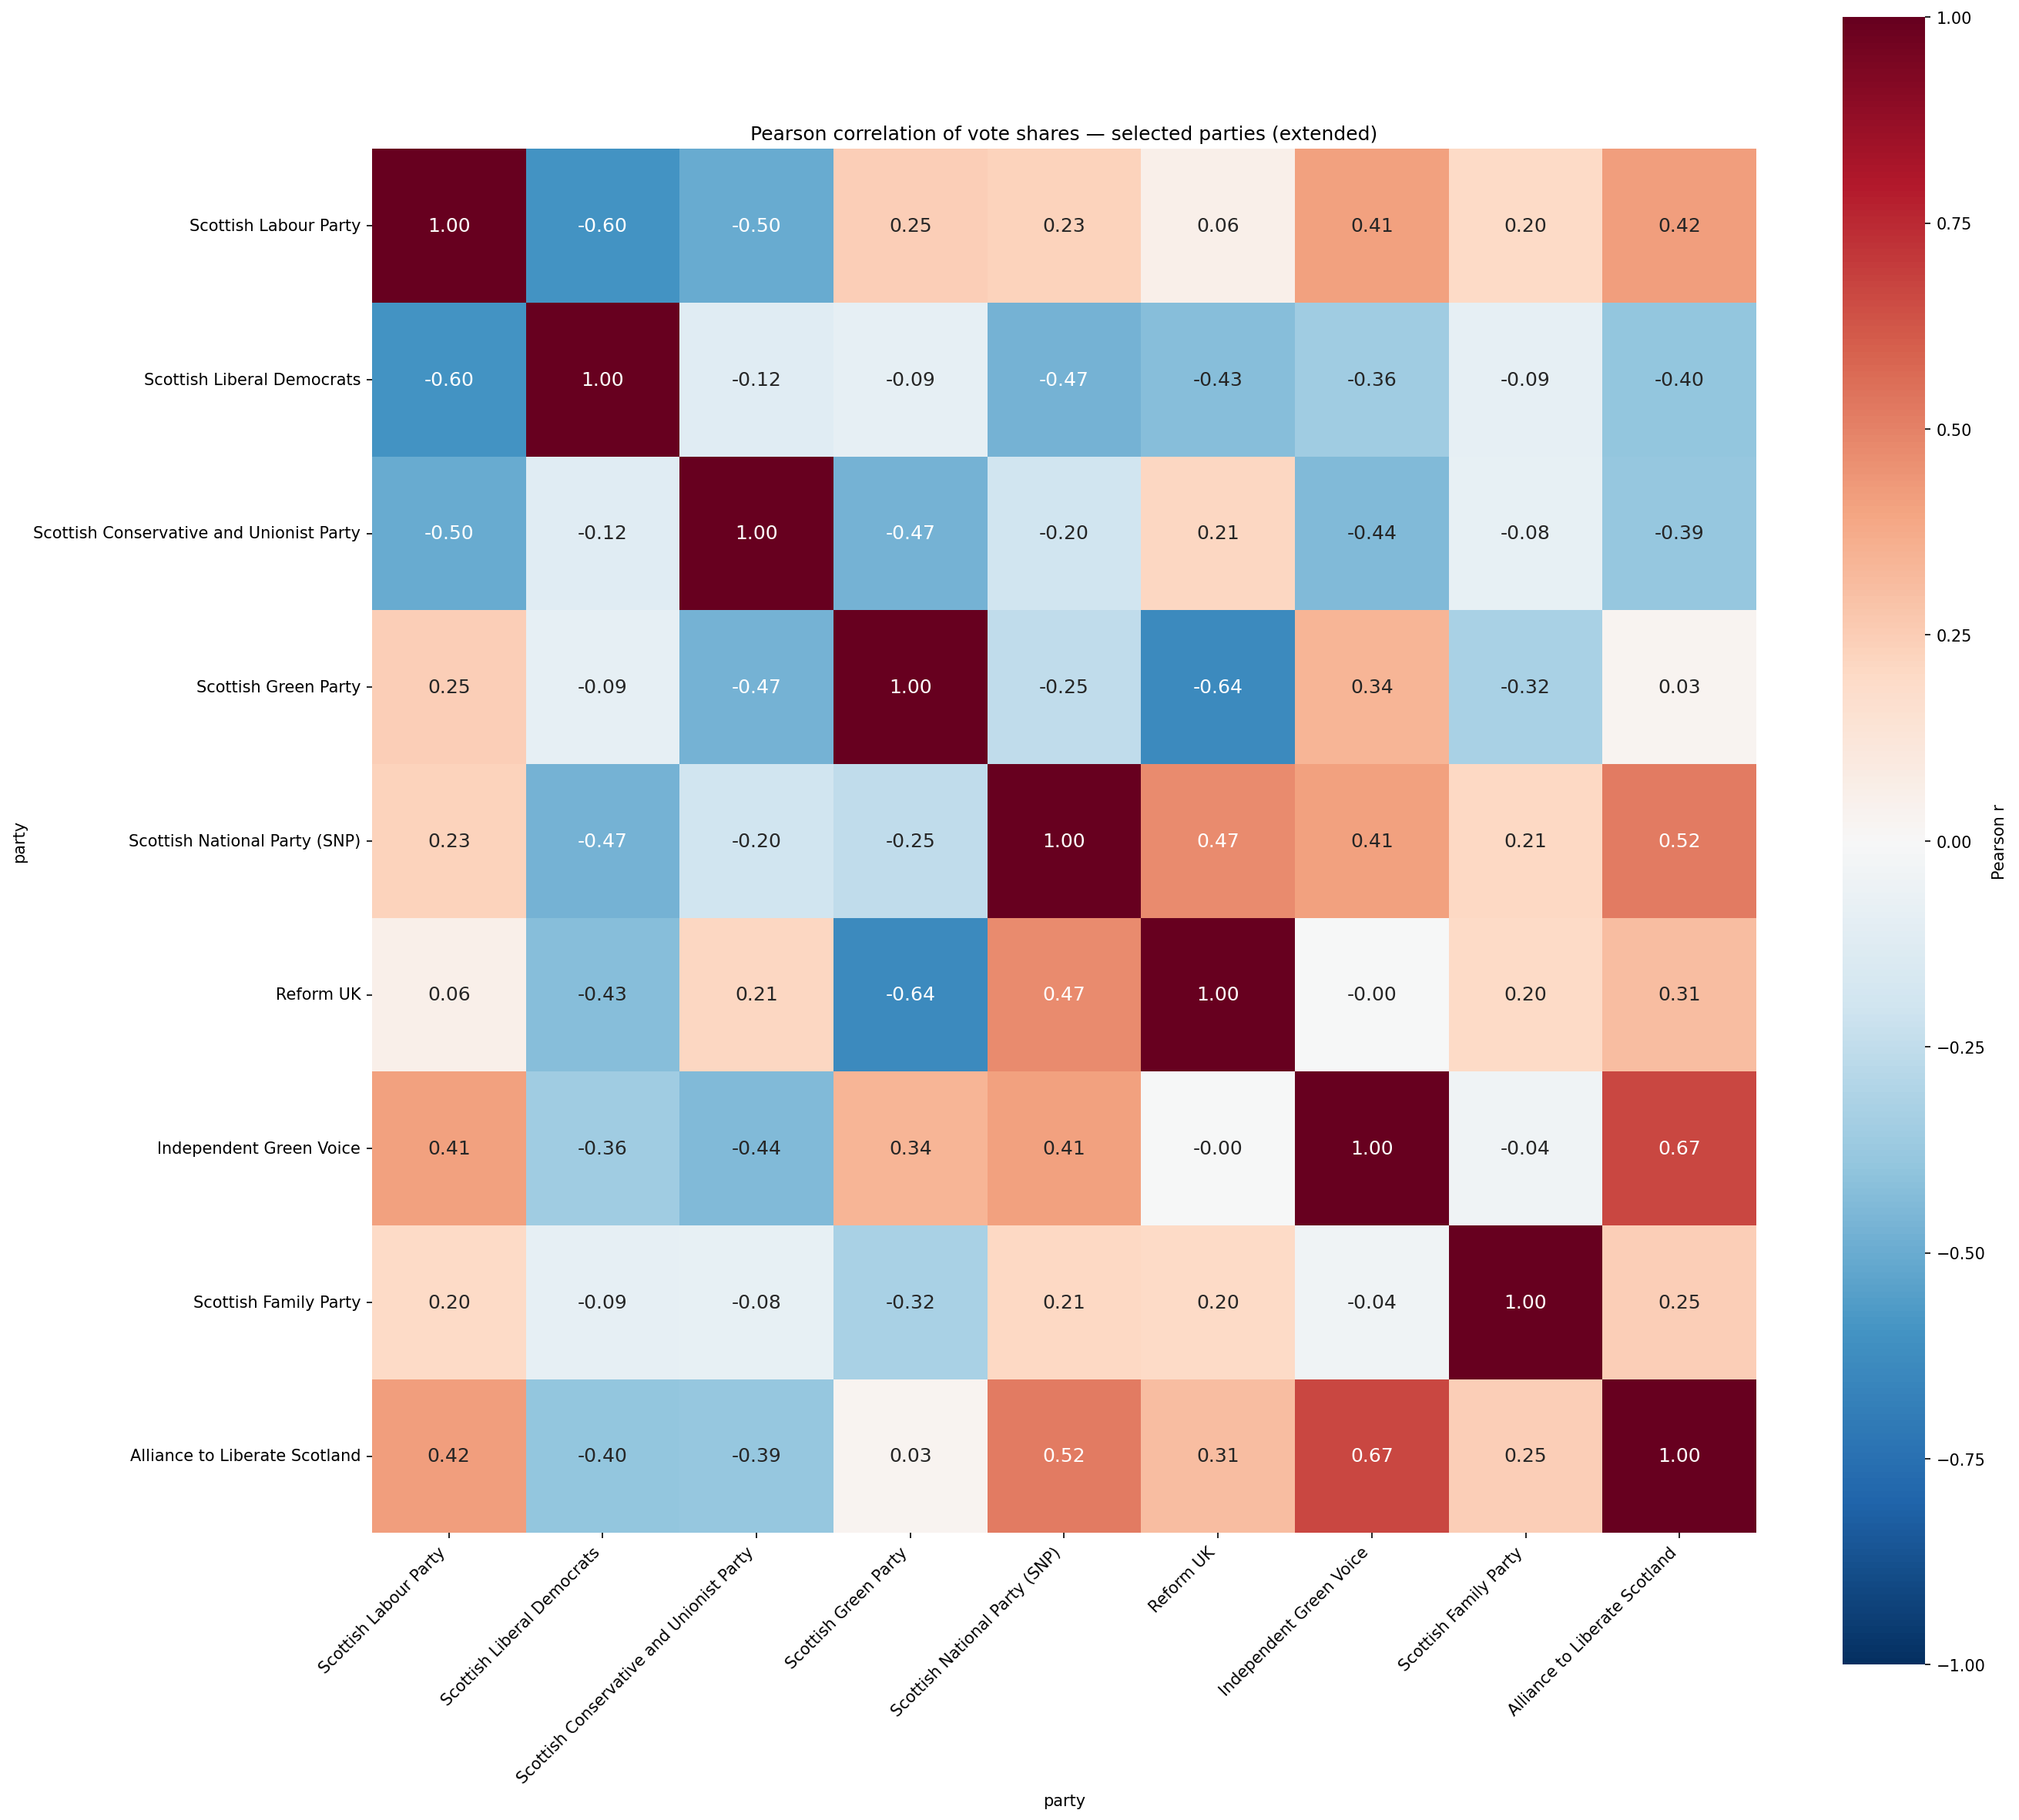
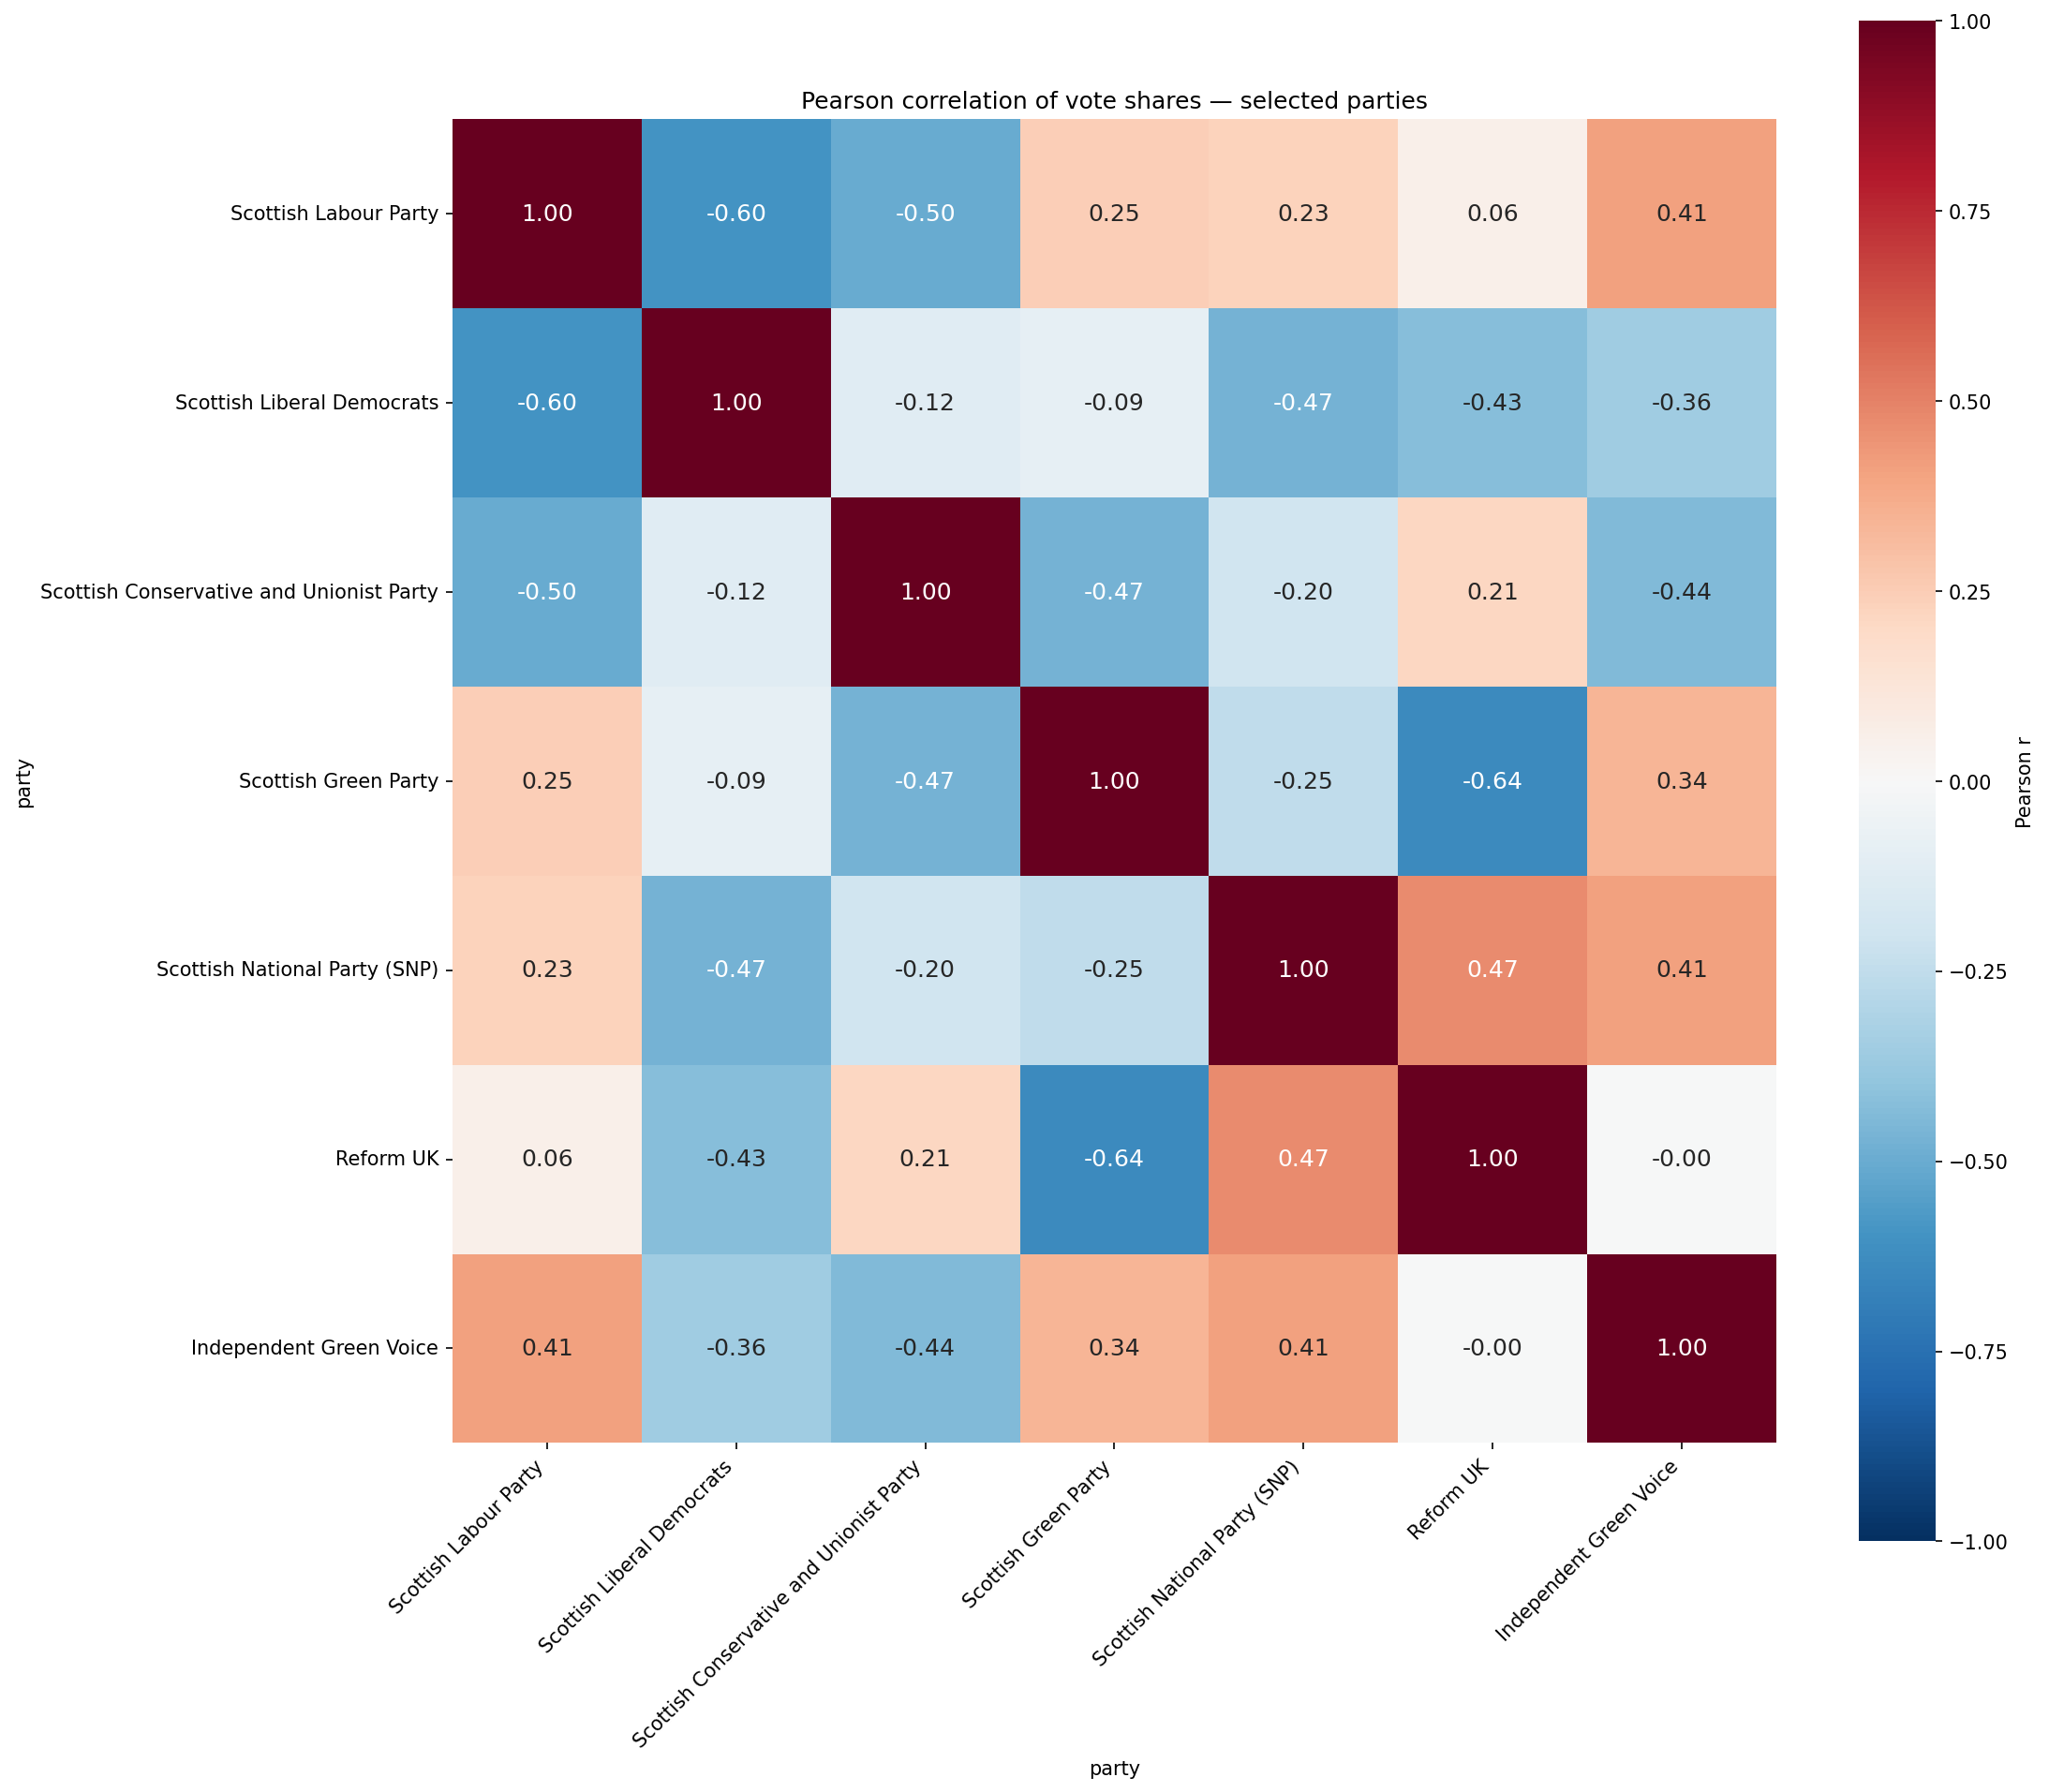
The figure below shows constituency correlations between all pairs of the major parties plus IGV:
The raw data is available in sp26_list_votes_correlations_shares_selected.csv.
If every vote for IGV were created by a small fraction of all voters mistakenly selecting the wrong "green" party, then the signature would be that the IGV vote would be a multiple of the SGP vote, and so there would be a very strong correlation (r close to 1) between vote shares.
However, this does not match the data well at all. The value of r is only 0.34, which is actually less than the correlation with Scottish Labour.
That rules out the possibility that the IGV vote share is just formed by a fixed fraction of the SGP vote across all constituencies (though see later sections for more detail).
The question here is whether the IGV vote share is wildly higher than is consistent with a party that did not campaign. The signature of this would be that IGV did better than other tiny parties with no significant basis.
From the EMB data spreadsheet, the parties that ran in every region (other than the big six) got the following total votes.
| Party | Total votes |
|---|---|
| Alliance to Liberate Scotland | 19318 |
| Independent Green Voice | 19975 |
| Scottish Family Party | 17136 |
| Scottish Socialist Party | 8326 |
Of these, Scottish Family Party and Scottish Socialist Party campaigned, which presumably helped them, but also have baggage that may have hurt them. I never noticed Alliance to Liberate Scotland campaigning (and had not heard of them!) but apparently they had campaigned locally too. IGV did not compaign at all.
Some other parties (Advance UK, for example) ran in a subset of regions and did substantially worse than IGV (around a quarter as many votes). That example is for a group that seems to have had at least some online presence and a known (if not terribly well-known) leader.
In other words, IGV did a fair bit better than you'd expect with no campaigning. I'm reluctant to try to quantify this given the limited data I have - other people will have more knowledge here.
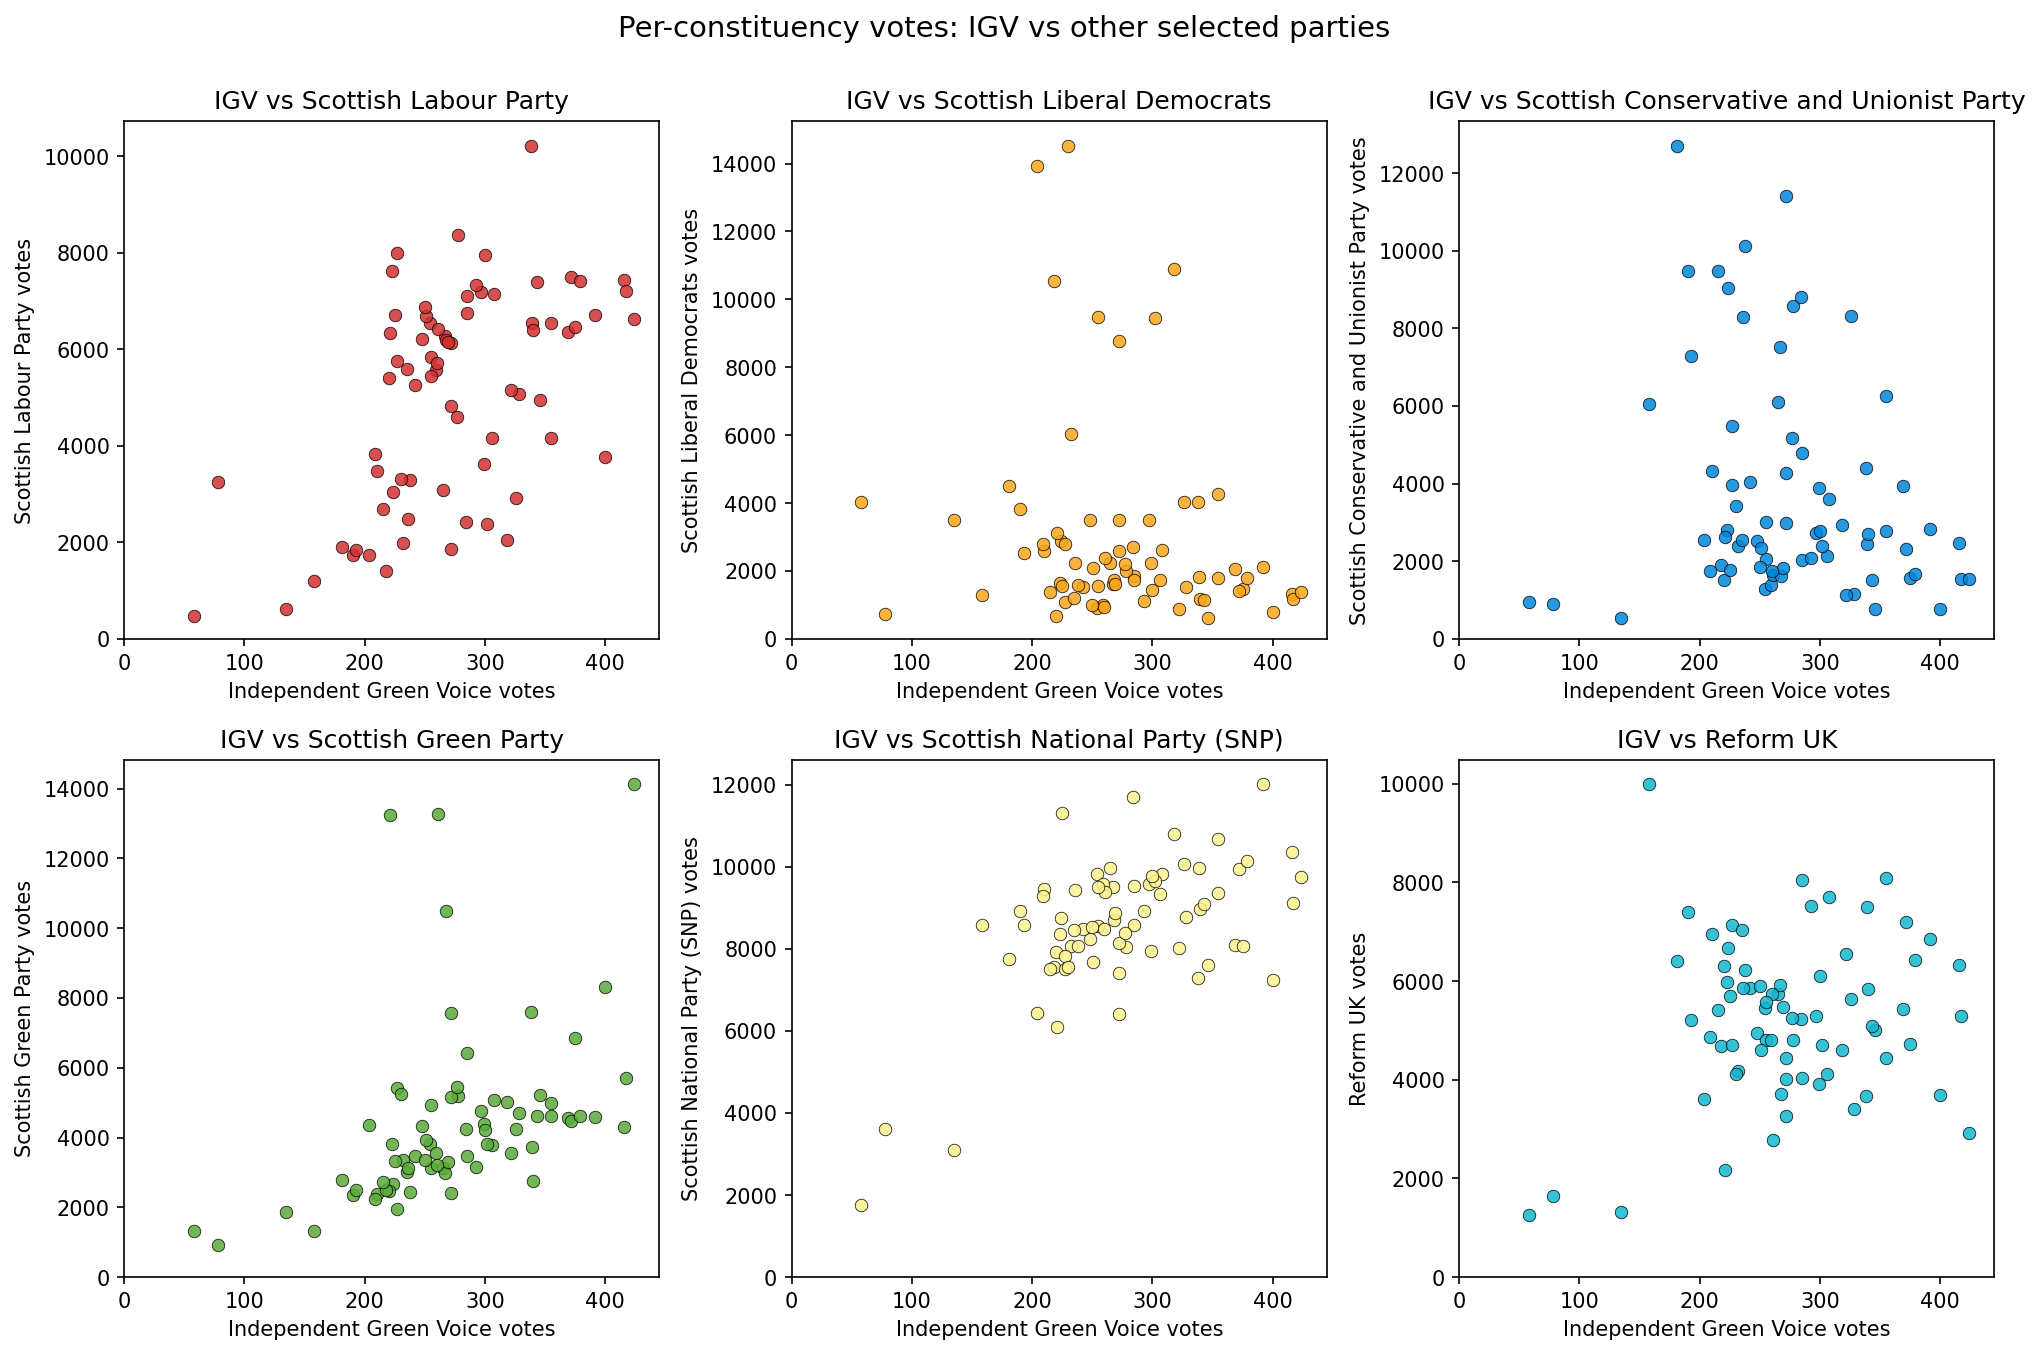
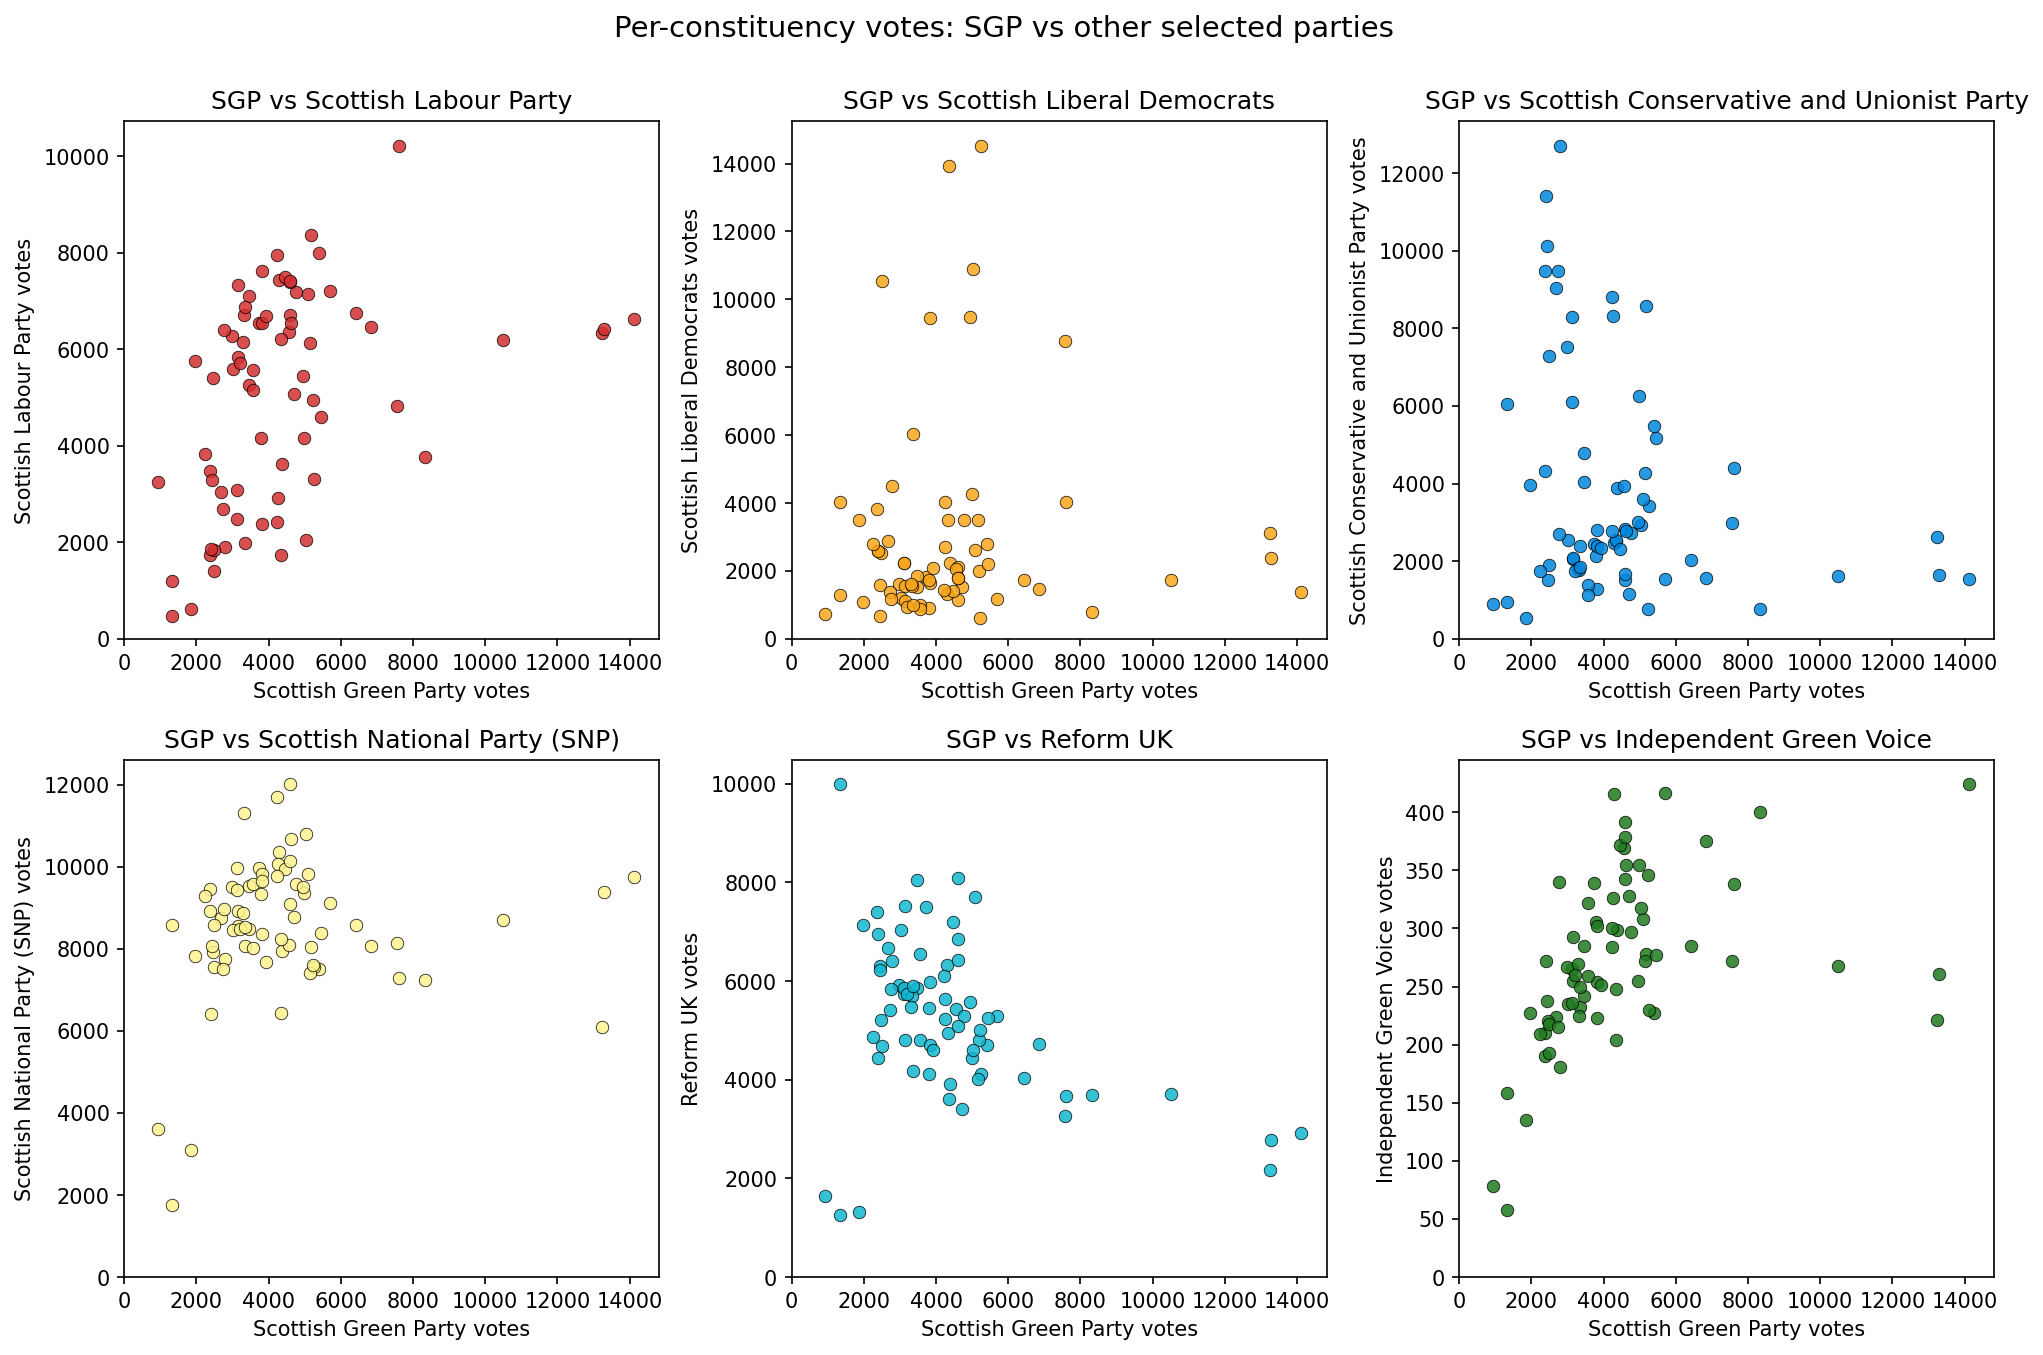
Next, I plotted some scatterplots of SGP and IGV vote share against other parties. The SGP results are unsurprising - decent correlation with Labour, anti-correlation with Conservative and Reform, and we'll come back to IGV.
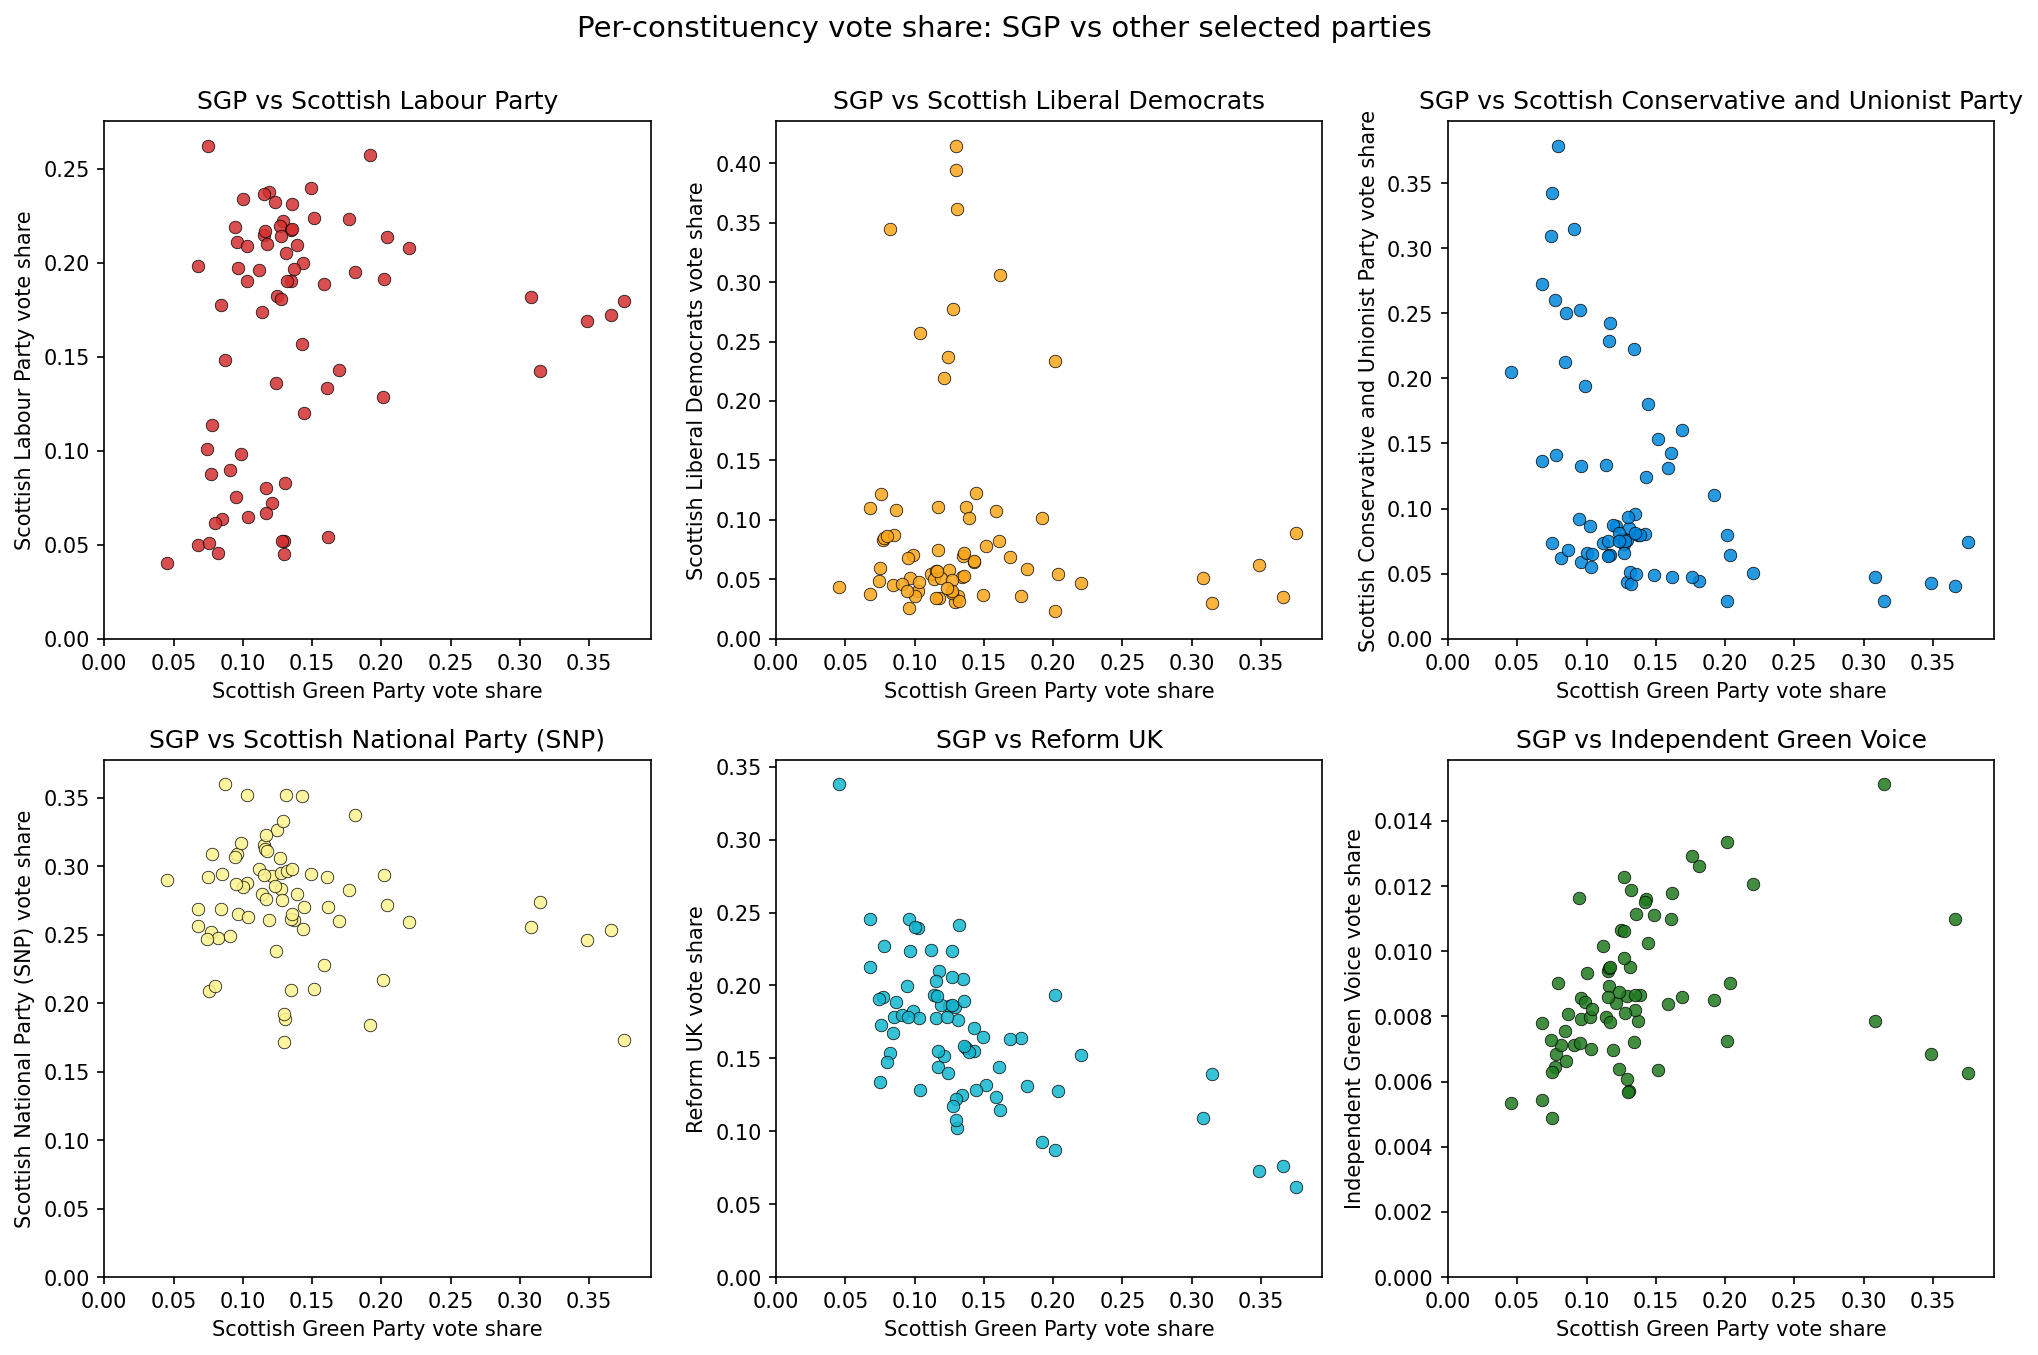
The IGV scatter plots are quite enlightening. For most parties they show what you might expect from the correlations above, but for SGP they seem to show a strong linear relation except where the SGP vote share is very large.
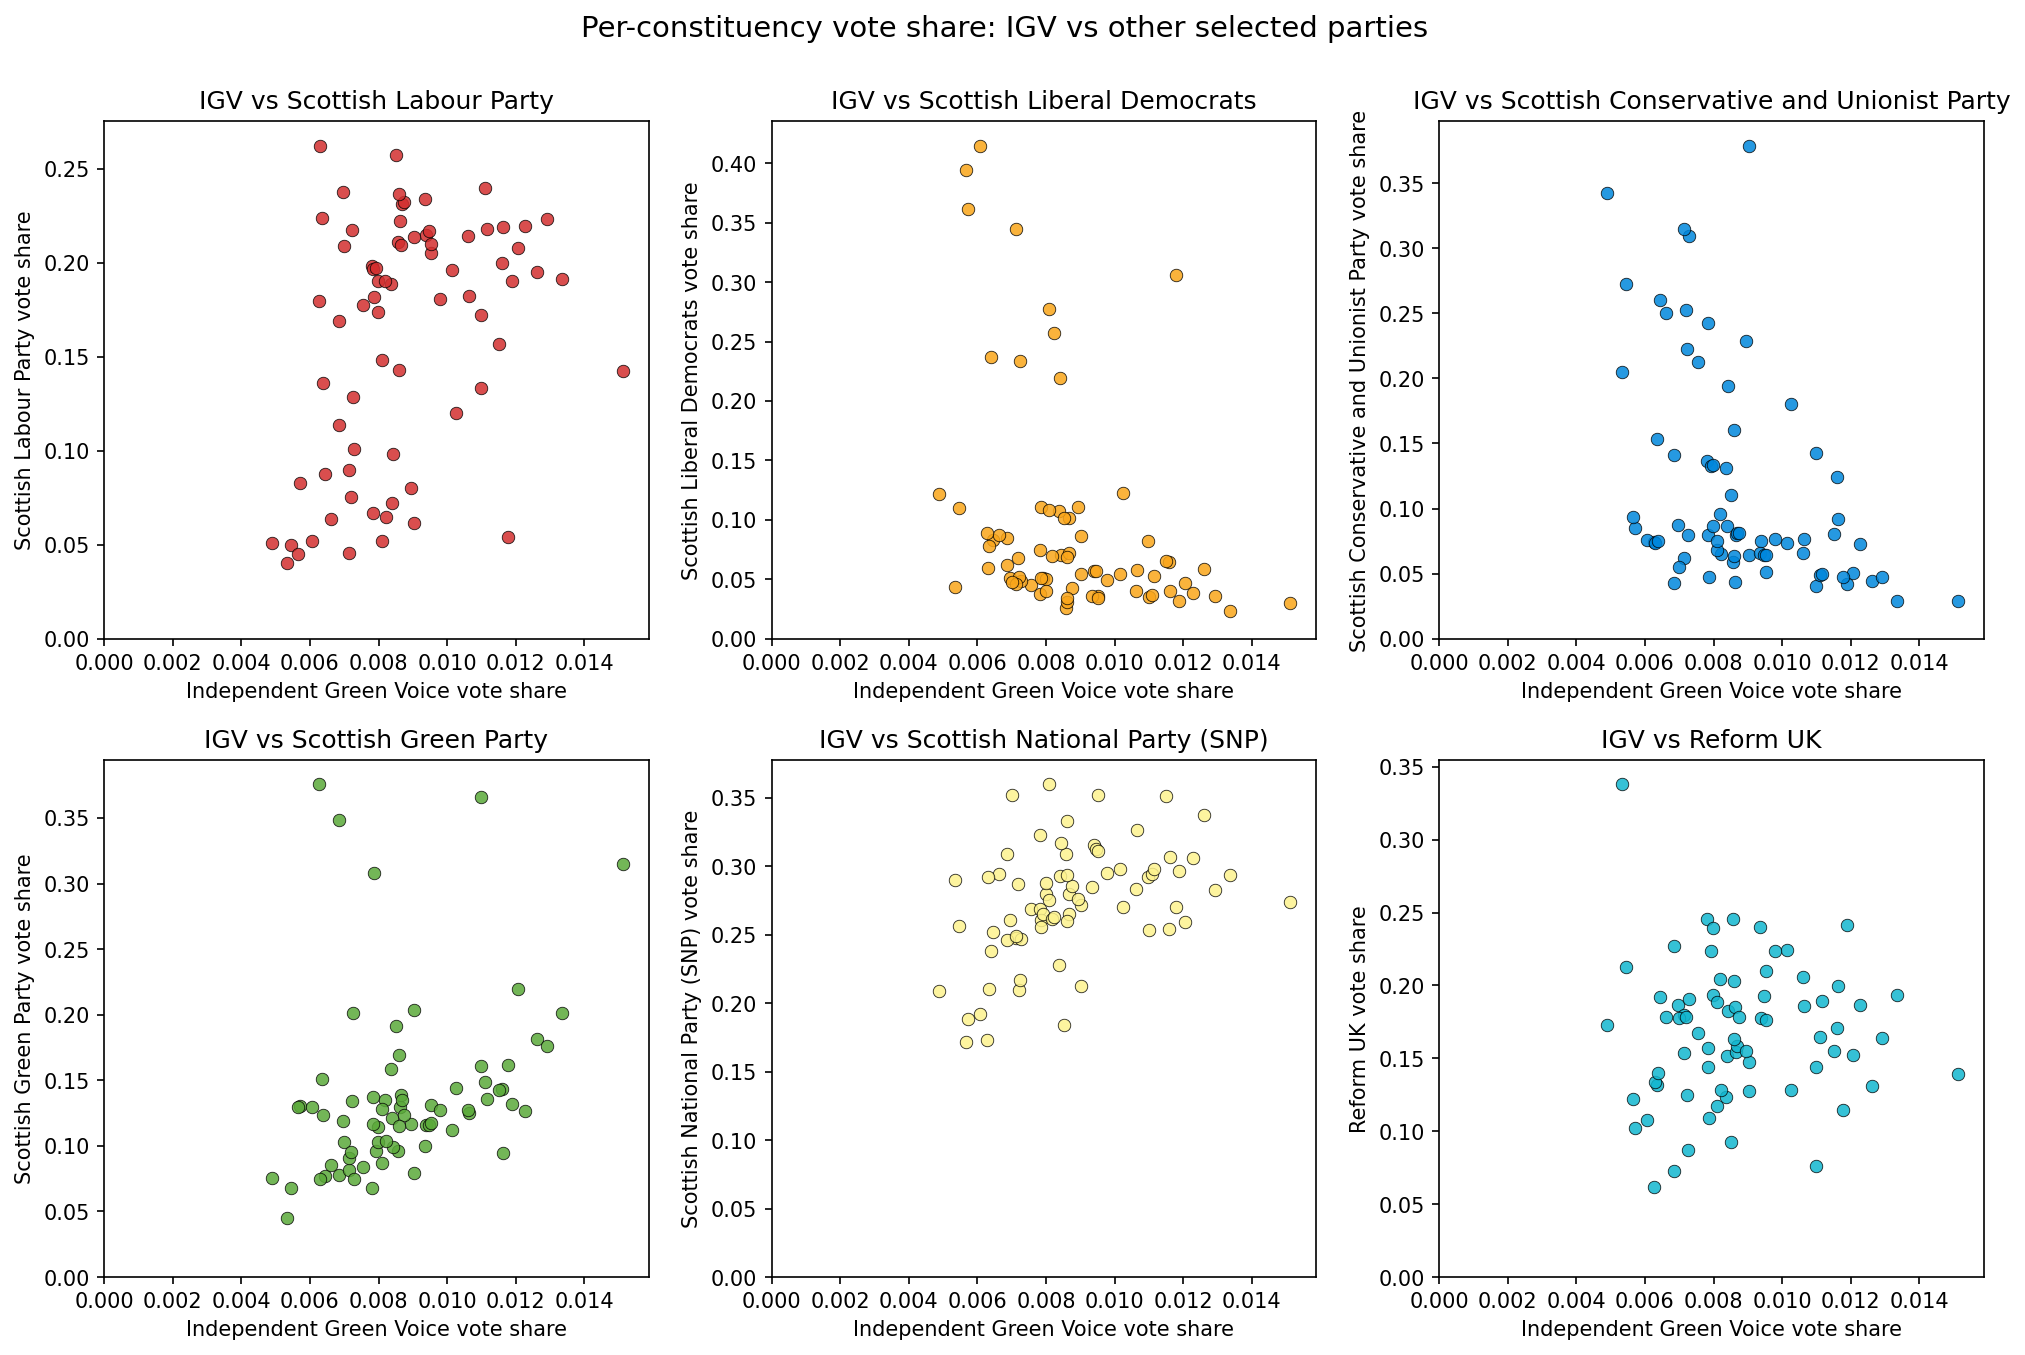
There is a logical explanation for this. The seats with the highest vote SGP share were the urban Glasgow and Edinburgh seats which saw heavy SGP campaigning. In those locations the campaigning would be expected to reduce voter confusion between the parties (activists telling people to beware of IGV, lots of visibility of Scottish Greens logos and so on).
What happens if we remove Glasgow and Edinburgh (all constituencies in their regions)? The argument here is that they are qualitatively different, so we should look for a signal in the rest of the data.
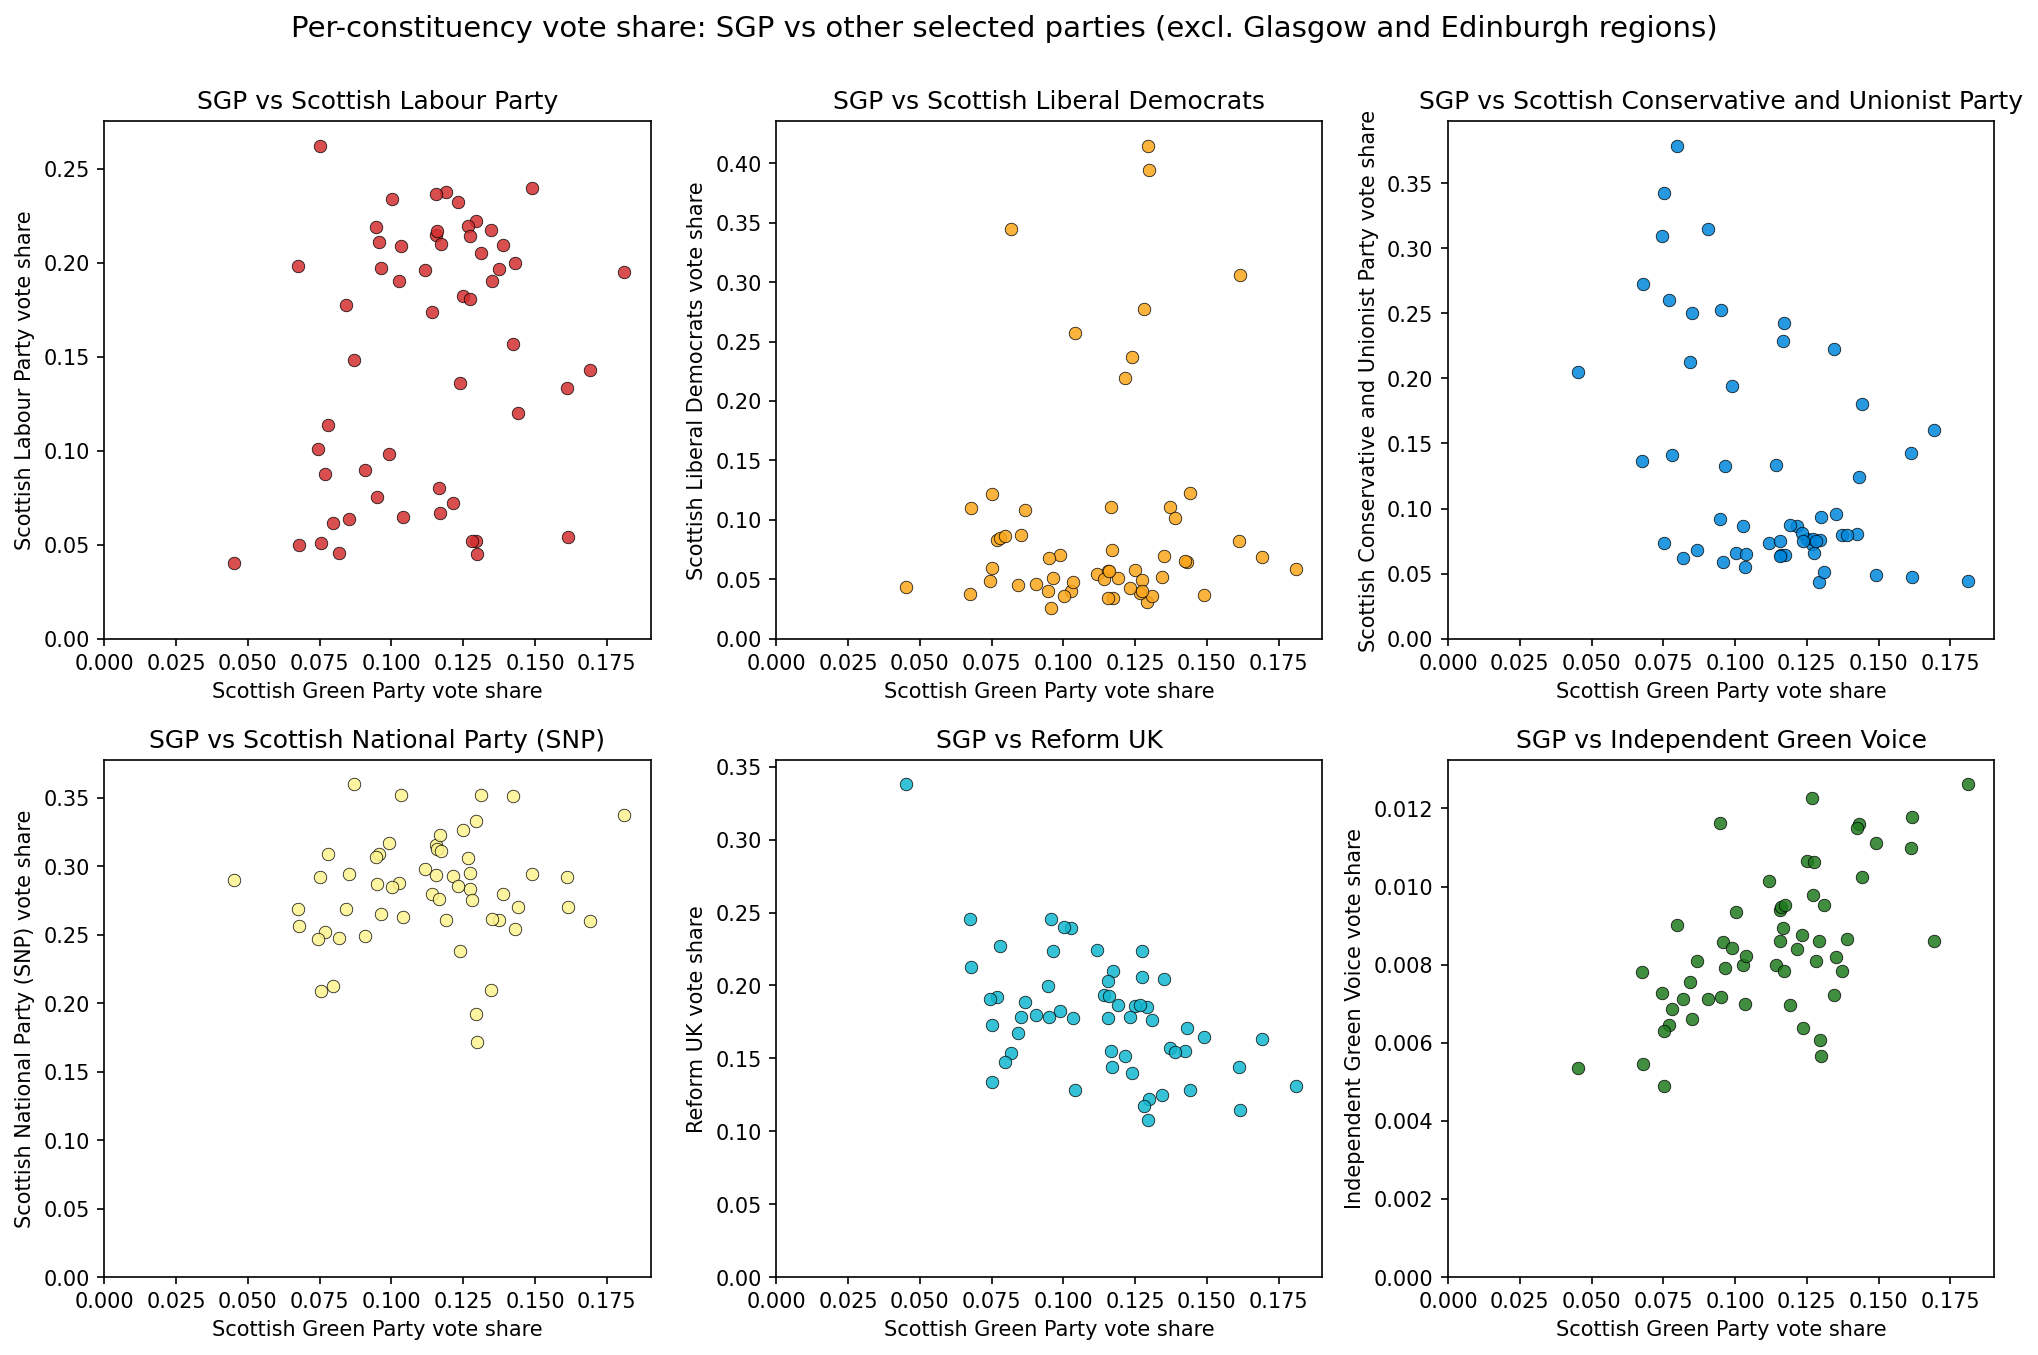
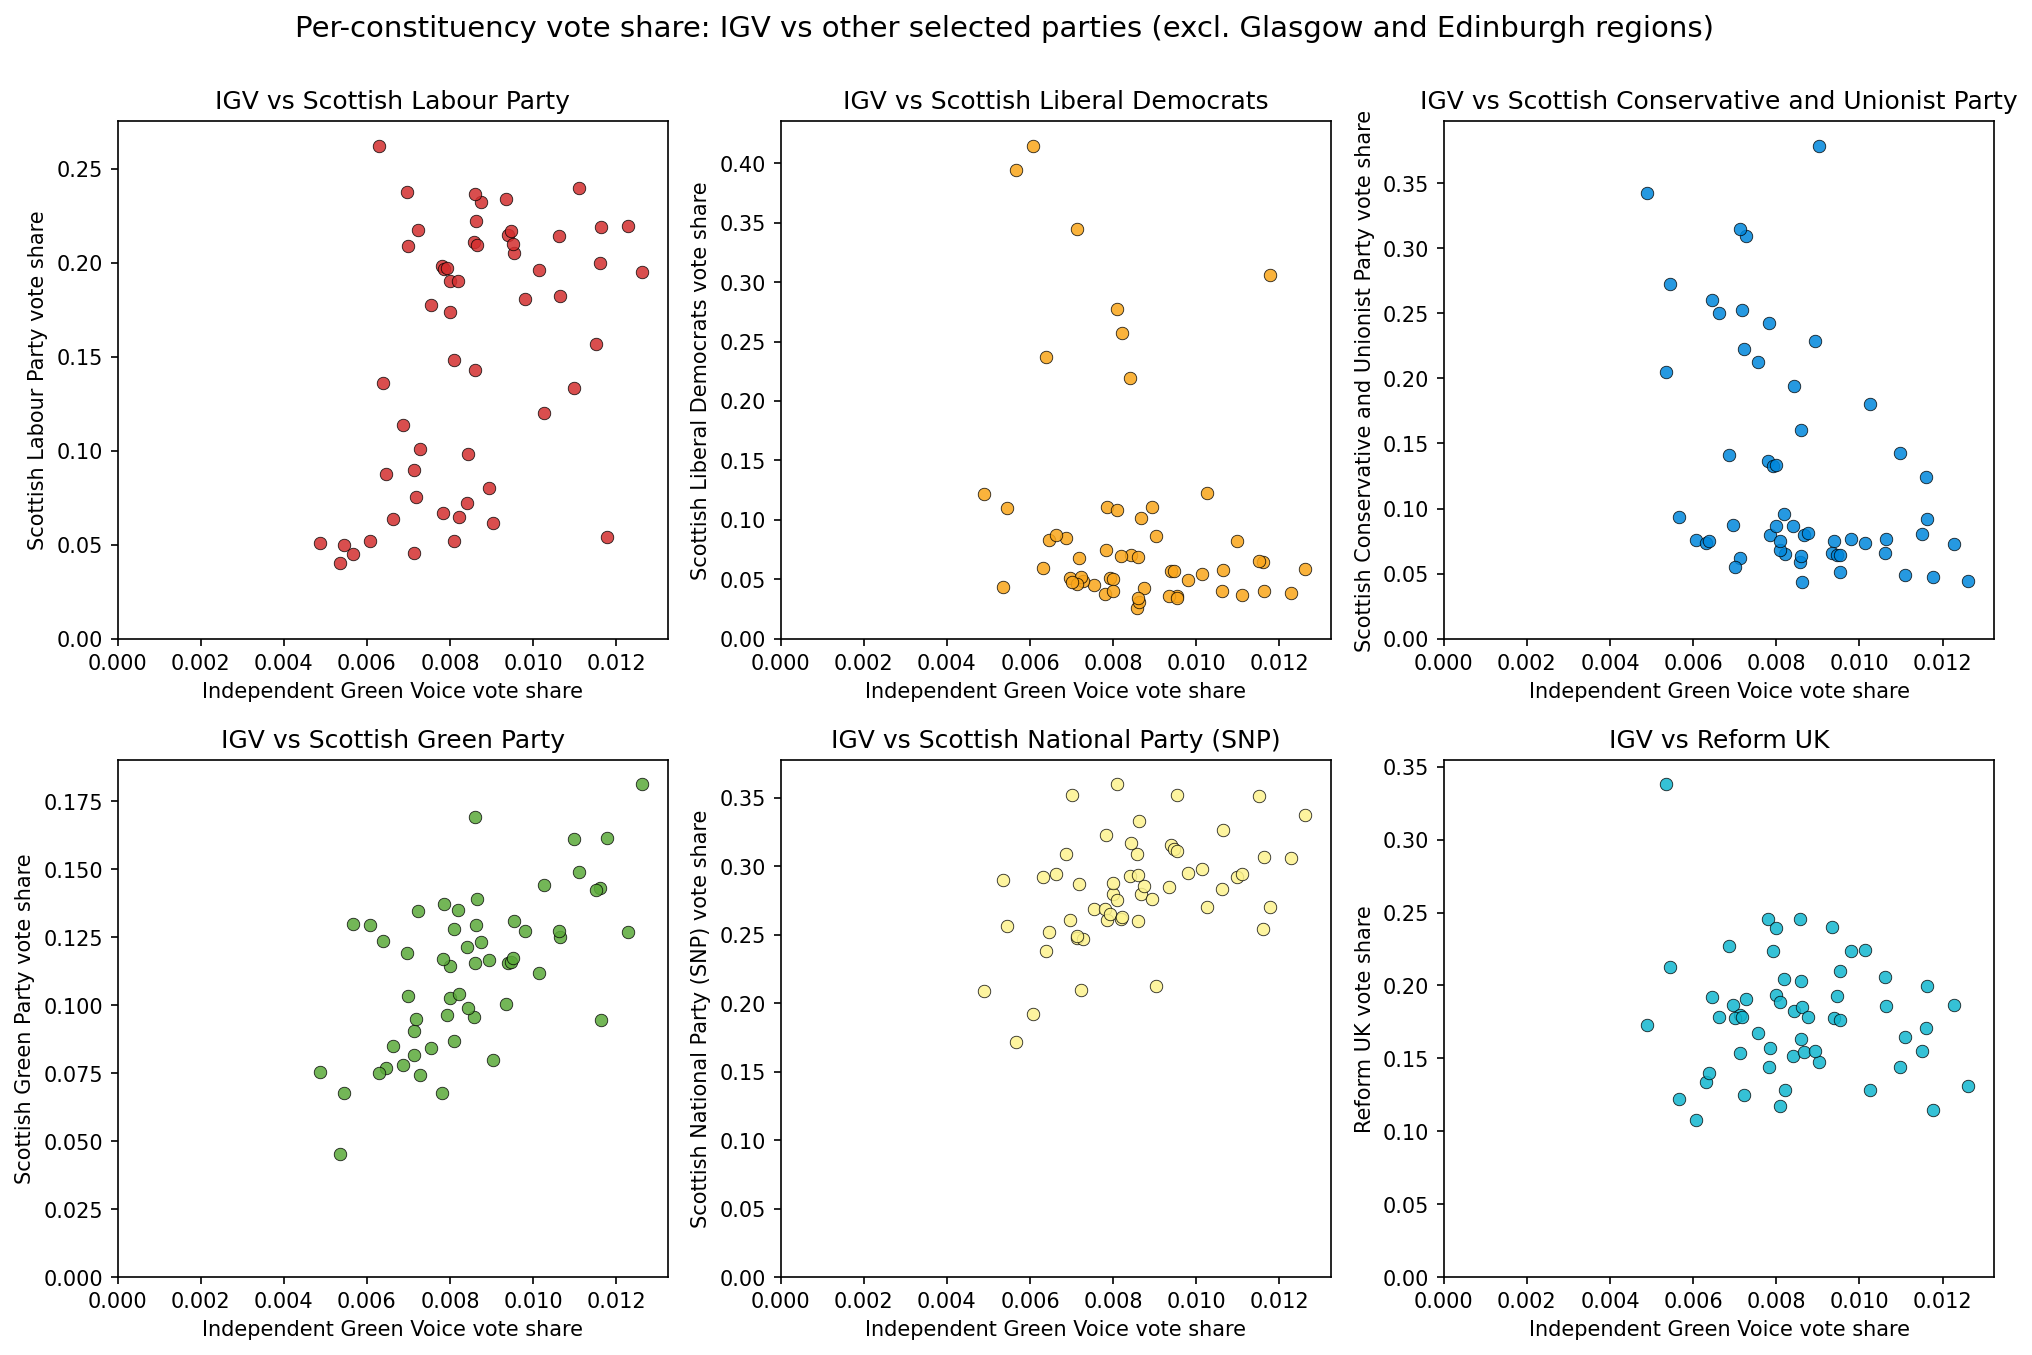
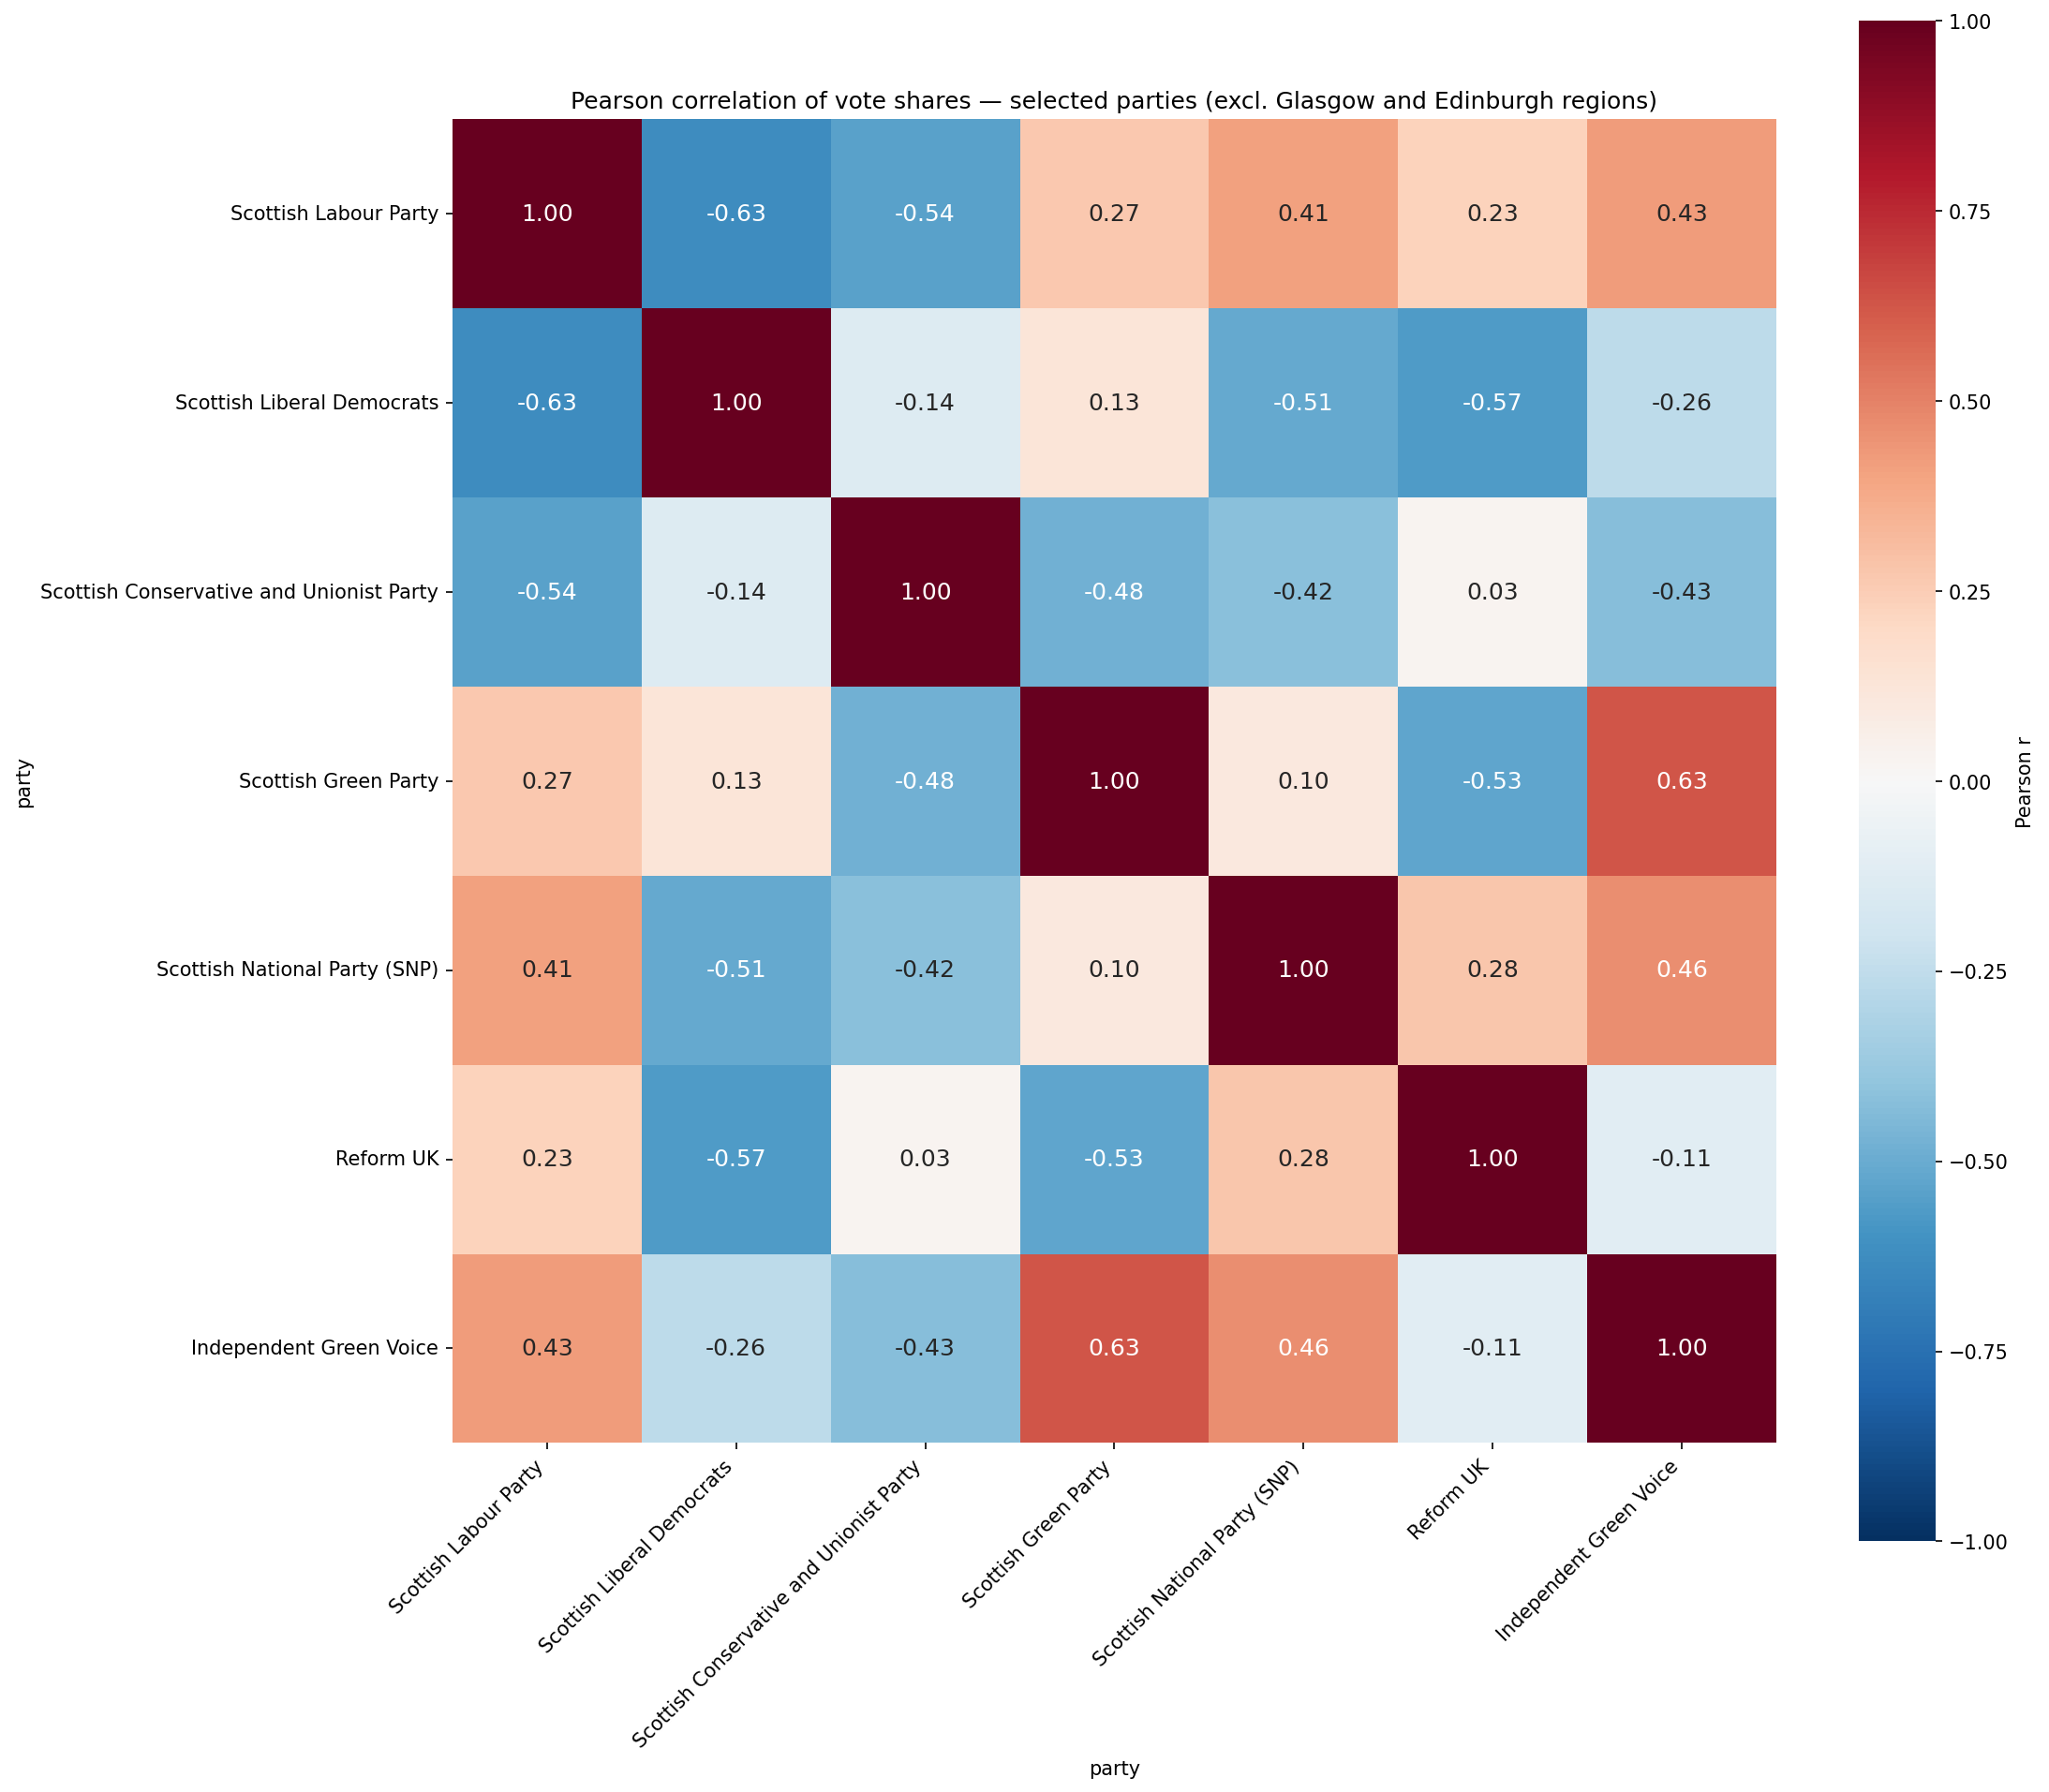
These results show that outside of Glasgow and Edinburgh, there is a strong, apparently linear, correlation between SGP and IGV vote share. Within Glasgow and Edinburgh, that correlation just does not exist.
SGP candidates ran in five Glasgow and Edinburgh constituencies where SGP support was strong, so this effect would be massively correlated with the Glasgow and Edinburgh effect. (SGP also ran in Shetland.) The scatter plot below shows constituencies where the Scottish Greens ran a constituency candidate in blue, and the ones where they did not in red.
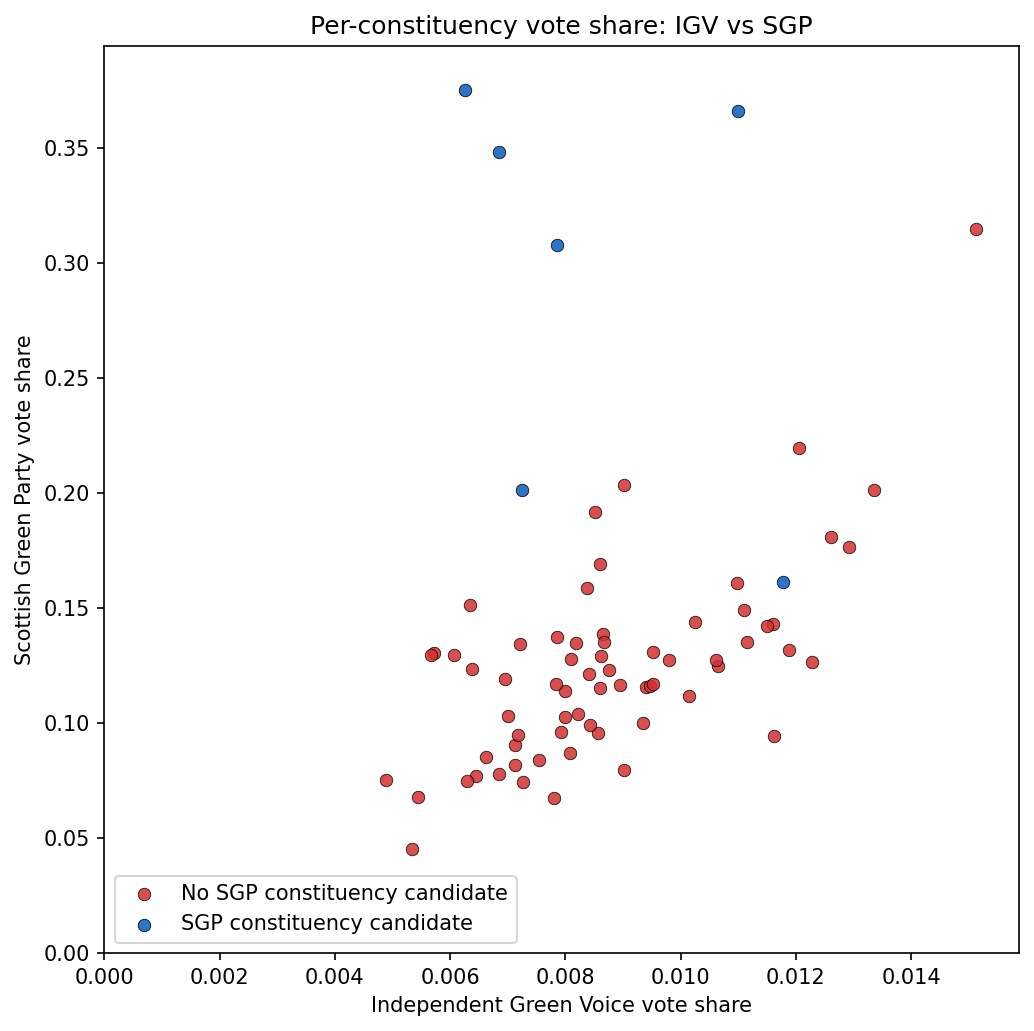
This shows that the anomalous list vote values match well with the constituencies where SGP ran candidates. The correlation matrix looks very marginally closer if we just exclude these seats rather than all of Glasgow and Edinburgh too (though so marginally that I don't want to read anything into it).
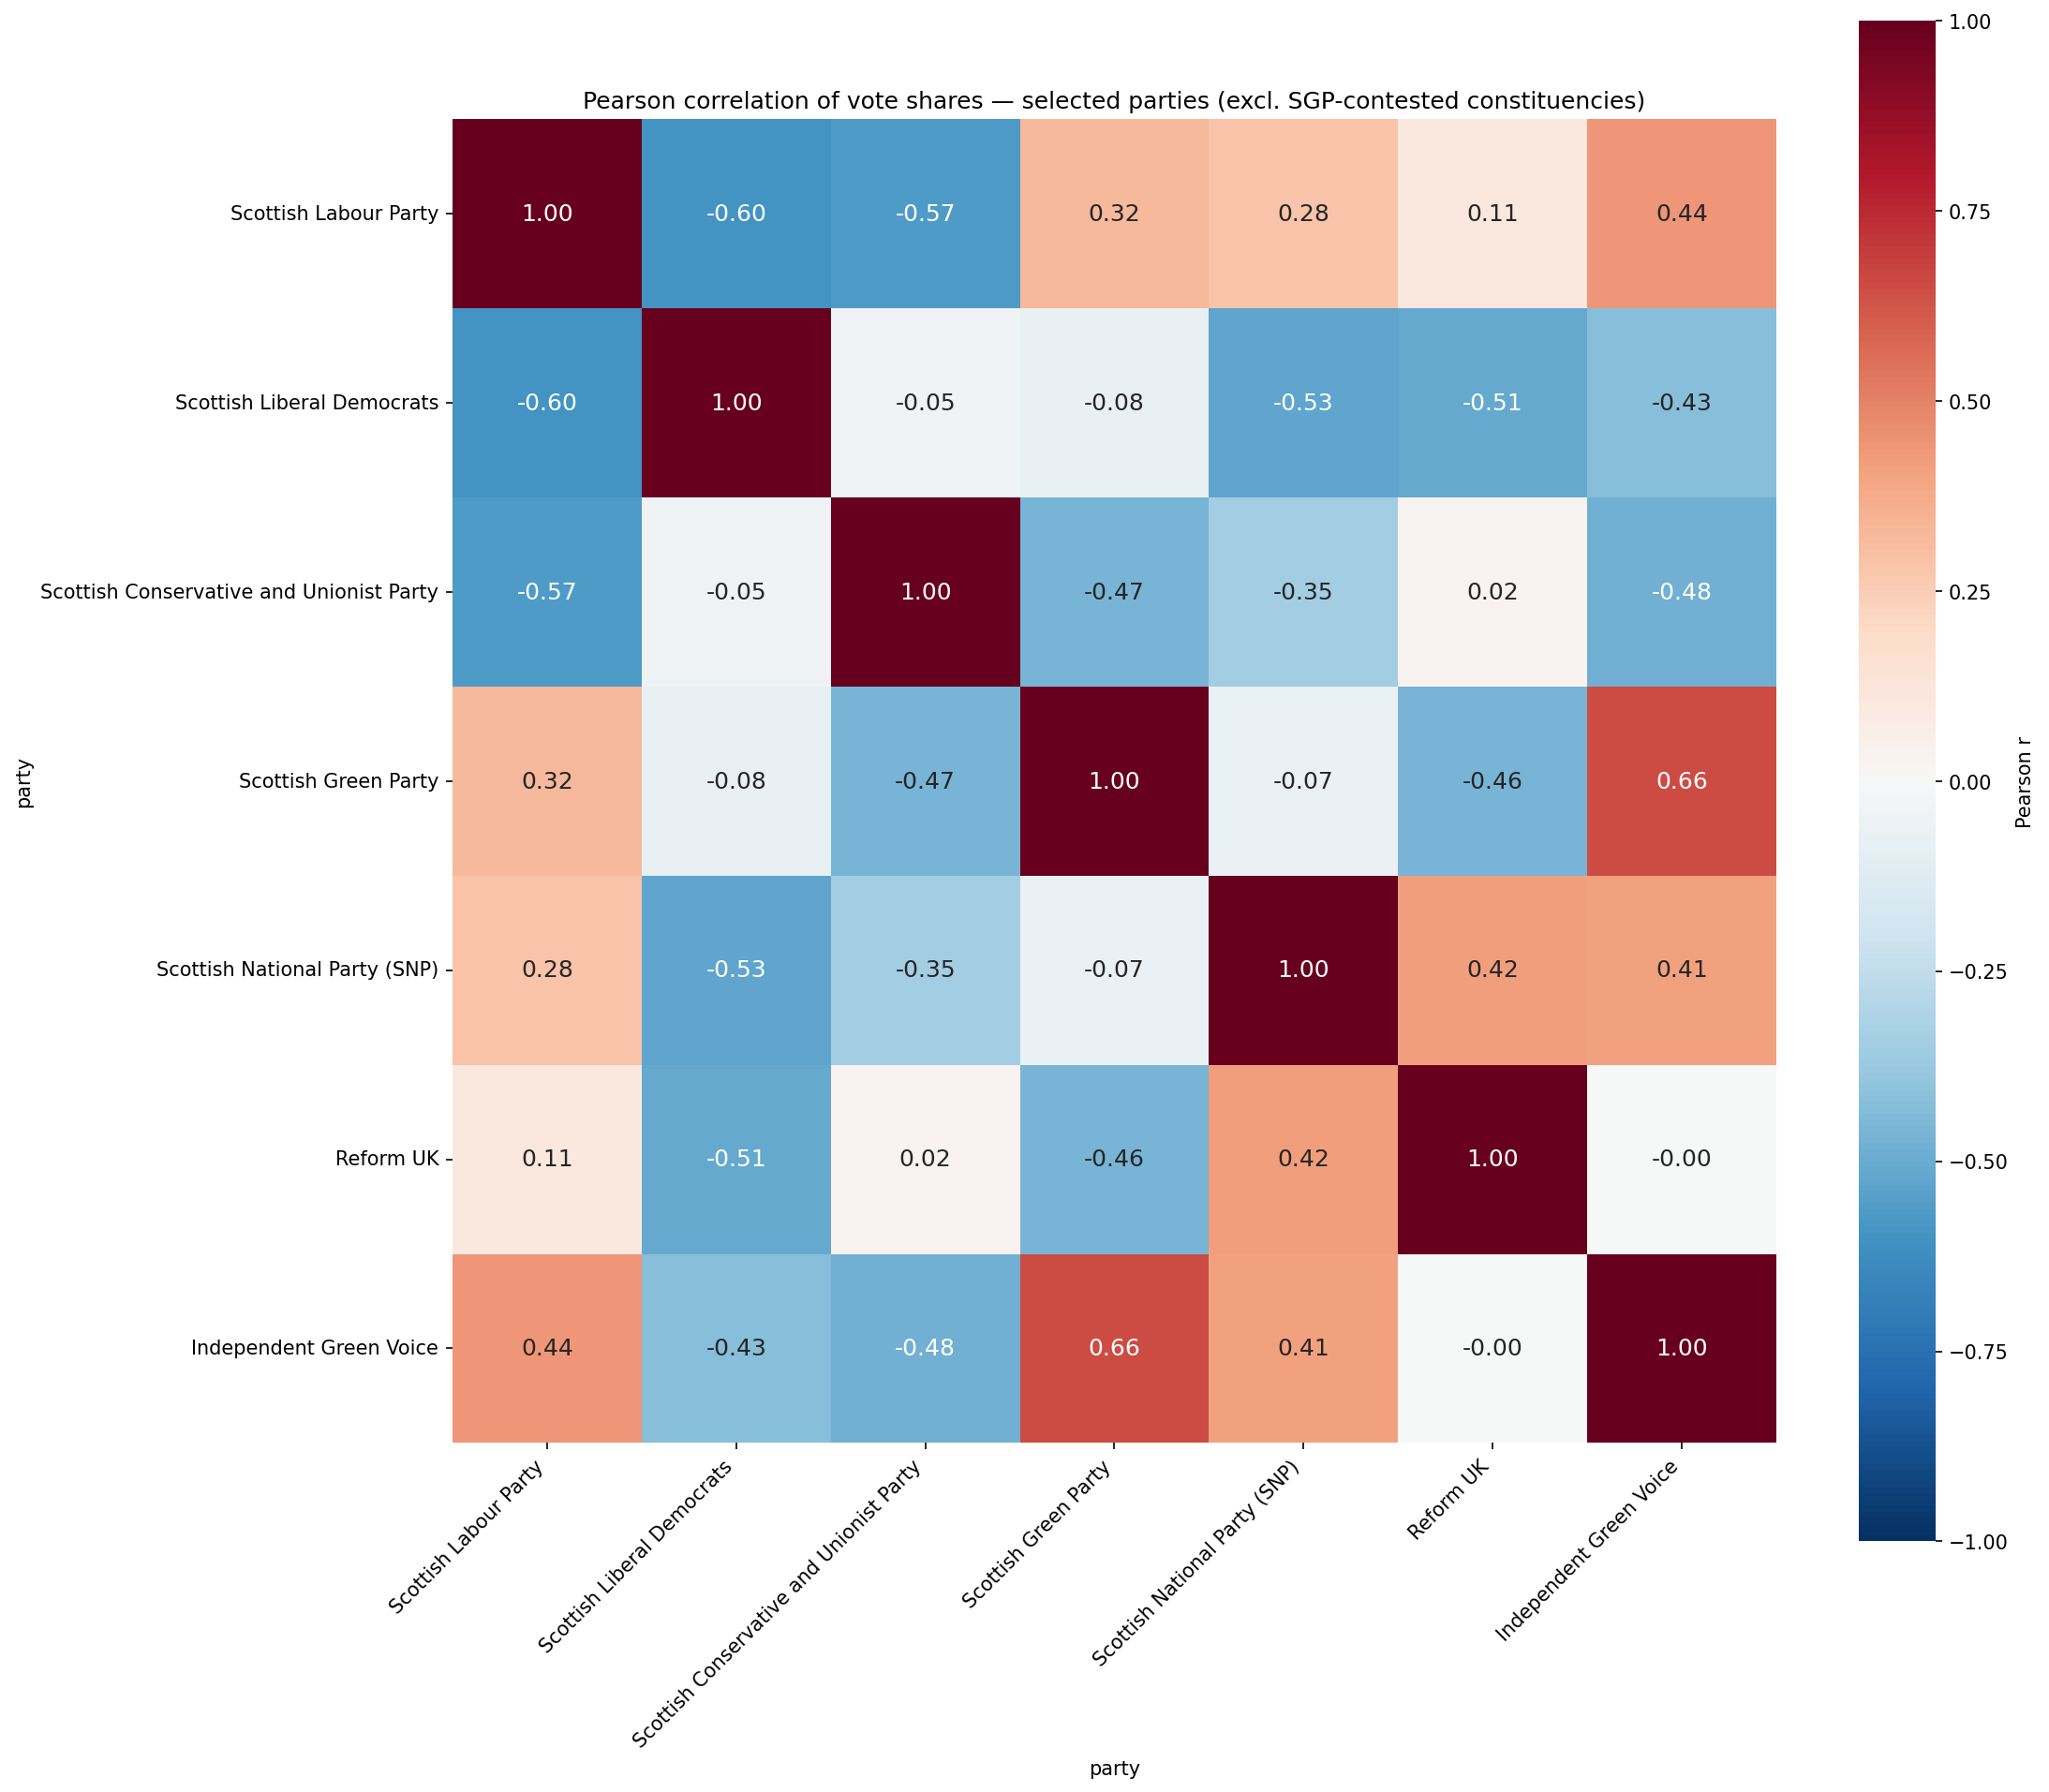
There are two possible interpretations for why this might be.
Any voter who might have been confused by the ballot and unsure which of IGV and SGP was the "real" green party would have literally had the other ballot paper in front of them at the time of voting with the SGP logo and name.
Heavy campaigning reduced the voter mistake rate, and seats where SGP ran a constituency candidate are exactly those where there was heavy campaigning. This is just a very precise way to identify these seats.
We can't distinguish between these two effects.
The main points from the above are the following.
IGV did do better than you would expect for a party that did zero campaigning and had no online presence (though did exist in previous elections). From the data, it seems several times better, but I'm not going to pretend I can put a proper number on it.
There is only a loose correlation between IGV and SGP list vote share over all constituencies.
However, if you completely remove data either for both the Edinburgh and Glasgow region constituencies, or for constituencies where SGP was running a constituency candidate (mostly in Edinburgh / Glasgow), then there is a strong linear correlation.
The best explanation of the data I can find is the following.
IGV picked up a significant fraction of its votes, perhaps most of them, through random error by voters who want to "vote green" but either got confused by the ballot or did not realise that IGV and Scottish Greens are separate parties. That effect did not happen ti SGP target seats where there was very heavy SGP campaigning (identified as either the Glasgow and Edinburgh seats, or as seats with constituency SGP candidates), as in those seats voters were more aware of the SGP name and branding and of the possibility of confusion with IGV.
Some caveats and comments.
Correlation does not imply causation. This is my best guess at the most likely explanation of the data, not proof.
There will be some voters who just like the sound of "Independent Green Voice" and mark the box; that could well be correlated with number of SGP votes for demographic reasons and swamped by votes in strong SGP votes, so could in principle explain the data. However, it seems implausible that this could cause the entire effect (because the vote numbers for IGV seem too large compared to other minor parties).
Note that if many voters just voted based on how much they like the name or picking the first from the list, then that is sad for Scottish democracy, but not a problem for the electoral commision (unlike where a large number of voters were confused by the ballot).
IGV did campaign in previous elections, just not in this one. Maybe some of that campaigning had an effect in driving up their total vote share? It seems unlikely to me as a major factor, but I'm no expert.
I did run a linear regression analysis on the data. It tells you nothing that the scatterplots don't show better.
I also had a look at the 2021 data. The scatterplots look broadly similar, though the differential effect of the extreme seats (the Edinburgh / Glasgow ones where the SGP did more 2026 campaigning) are smaller. As a result, the correlation between IGV and SGP is very strong (+0.69 on the full data set with no seats excluded).
| File | Contents |
|---|---|
SP_2026___Votes_and_Seats.xlsx |
Source spreadsheet from the Electoral Management Board for Scotland covering region-level list and constituency results for the 2026 Scottish Parliament election. |
sp26_list_votes_all.csv |
Wide-format view of the per-constituency list votes — one row per
constituency, columns region, constituency,
then one column per party (alphabetical order) with vote counts. Parties
that did not stand in a given constituency appear as zero. Scraped from
council websites reporting of results. |
sp26_list_votes_correlations.csv |
Full party × party Pearson correlation matrix using raw vote counts across constituencies. Parties that did not stand in a given constituency are treated as zero. |
sp26_list_votes_correlations_shares.csv |
Full party × party Pearson correlation matrix using each constituency's vote shares (fractions of valid ballots). Removes the effect of constituency size and turnout. |
sp26_list_votes_correlations_shares_selected.csv |
Vote-share correlation restricted to the seven main parties (IGV, Labour, Lib Dems, Conservatives, Reform UK, Greens, SNP). |
sp26_list_votes_correlations_shares_selected.png |
Heatmap of the seven-party vote-share correlation above. |
sp26_list_votes_correlations_shares_selected_extended.csv |
Same constituency-level vote-share correlation as above, extended with Scottish Family Party and Alliance to Liberate Scotland. |
sp26_list_votes_correlations_shares_selected_extended.png |
Heatmap of the extended vote-share correlation above. |
sp26_list_votes_correlations_shares_selected_region.csv |
Seven main parties, but with constituency totals aggregated to region level first — correlations are then computed across the eight regions. |
sp26_list_votes_igv_scatter.png |
Per-constituency raw-vote scatter, IGV (x-axis) against each of the six other selected parties (y-axis), one subplot per party. Each axis scaled independently to its own party's maximum. |
sp26_list_votes_igv_scatter_shares.png |
Same as above but with each constituency's vote share (fraction of valid ballots) on each axis, removing the size-of-constituency effect. |
sp26_list_votes_sgp_scatter.png |
Per-constituency raw-vote scatter, Scottish Green Party (x-axis) against each of the other six selected parties (including IGV) on the y-axis. |
sp26_list_votes_sgp_scatter_shares.png |
Same as above but with vote shares on each axis. |
sp26_list_votes_correlations_shares_selected_excl_cities.csv |
Selected-party vote-share correlation matrix with all constituencies in the Glasgow and Edinburgh and Lothians East regions excluded — to test how much of the pattern is driven by the two city regions. |
sp26_list_votes_correlations_shares_selected_excl_cities.png |
Heatmap of the city-excluded correlation matrix above. |
sp26_list_votes_igv_scatter_shares_excl_cities.png |
IGV vote-share scatter as above, on the same city-excluded subset. |
sp26_list_votes_sgp_scatter_shares_excl_cities.png |
SGP vote-share scatter as above, on the same city-excluded subset. |